
Editor’s note: We are featuring the work of guest blogger Bekah McNeel, who writes on our site as Hall Monitor, in a four-part investigative series entitled Punished, Not Served: Unfair Discipline for Students with Disabilities. This is Part I.
In the first installment of this four-part series, we will look at statewide data broken down to demonstrate how some special education students are even less likely to be served (and more likely to be punished) than others. It’s important to disaggregate data so that that progress for one kind of disability does not mask injustice for others.
Texas’s poor reputation for compliance with the Individuals with Disabilities Education Act (IDEA) has become notorious. The state has denied students their right to free and appropriate education by refusing the classify their disabilities and underfunding special education (SPED) programs.
What we know about SPED inequities in Texas may be just the tip of the iceberg.
Discipline data, formal complaints, and parent testimony suggest that the problem goes well below the surface.
Even if the Texas Education Agency and the Legislature can wrangle themselves into compliance, there’s little right now to give parents hope that life on the ground will change. Budgets and policies may be amended, but many of the mechanics of SPED denial aren’t covered by such high level decisions. Every day SPED students sit in classrooms where they are misunderstood, over-disciplined, needlessly excluded from general education courses, and sometimes simply sent home without any kind of formal report.
The Punished, Not Served series takes a dive into those mechanics, the he-said-she-said of Individualized Education Plans (IEPs), disciplinary reporting, and the many ways children who learn differently ask for more than schools are willing to give.
The Devil (and Data) We Know
It’s difficult to know how many students in Texas have disabilities that merit special education services. Texas made news in 2016 for its suppression of SPED classification, capping the number at 8.5 percent, when the real number is probably closer to the national average, 13 percent.
The cap was officially lifted, and by 2017–18, 498,000 individual SPED classifications were registered with the state. If each of those represented one student, it would be about 9.22 percent of Texas K–12 students. However, many students have multiple diagnoses (i.e. learning disability and physical disability), so the real number of students receiving services could still be lower.
Whether it is nine percent or lower, the next statistic is one of the most damning.
In the 2017–2018 school year, 15.66 percent of all K–12 suspensions, expulsions, or referrals to alternative school were handed down to students with disabilities. This alone is a significant over-representation. Kids with disabilities are more likely to be disciplined than their general population classmates.
The numbers get worse with the more severe punishments. Of all of the students sent to juvenile justice academies, 20 percent were classified as SPED.
The deeper we dive into the data, the more the picture sharpens. It becomes more clear what is happening.
Look Closer at SPED Discipline Data
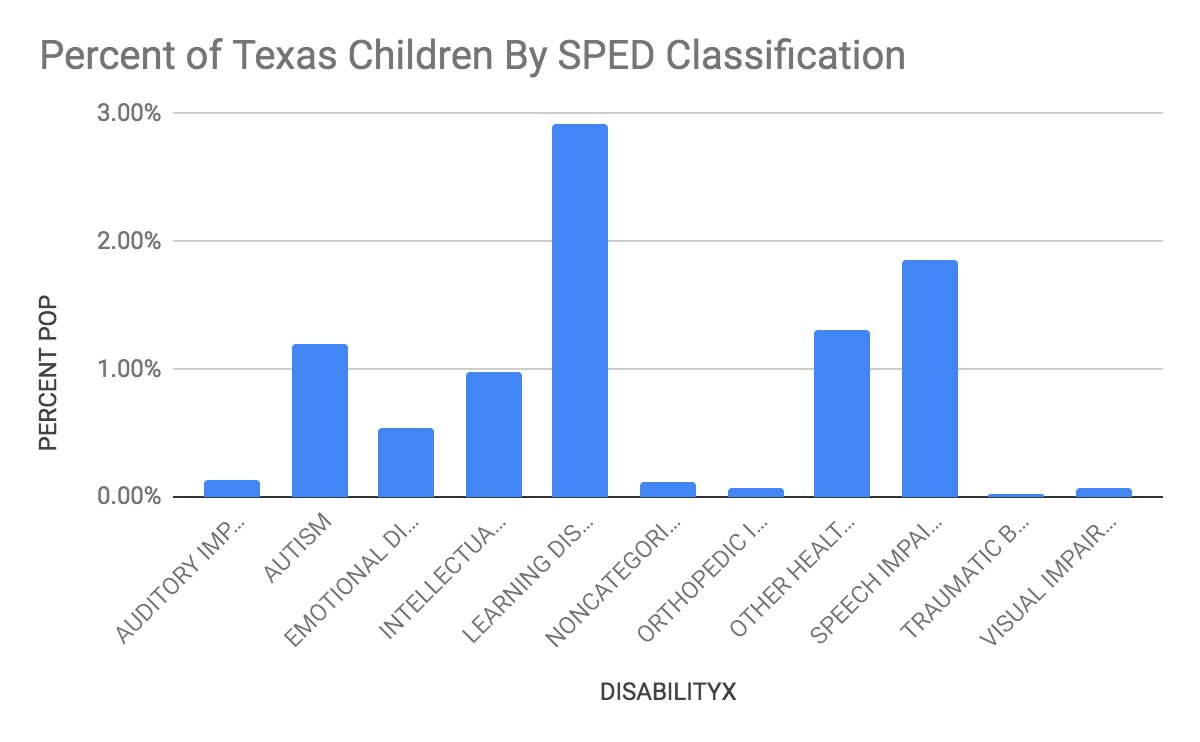
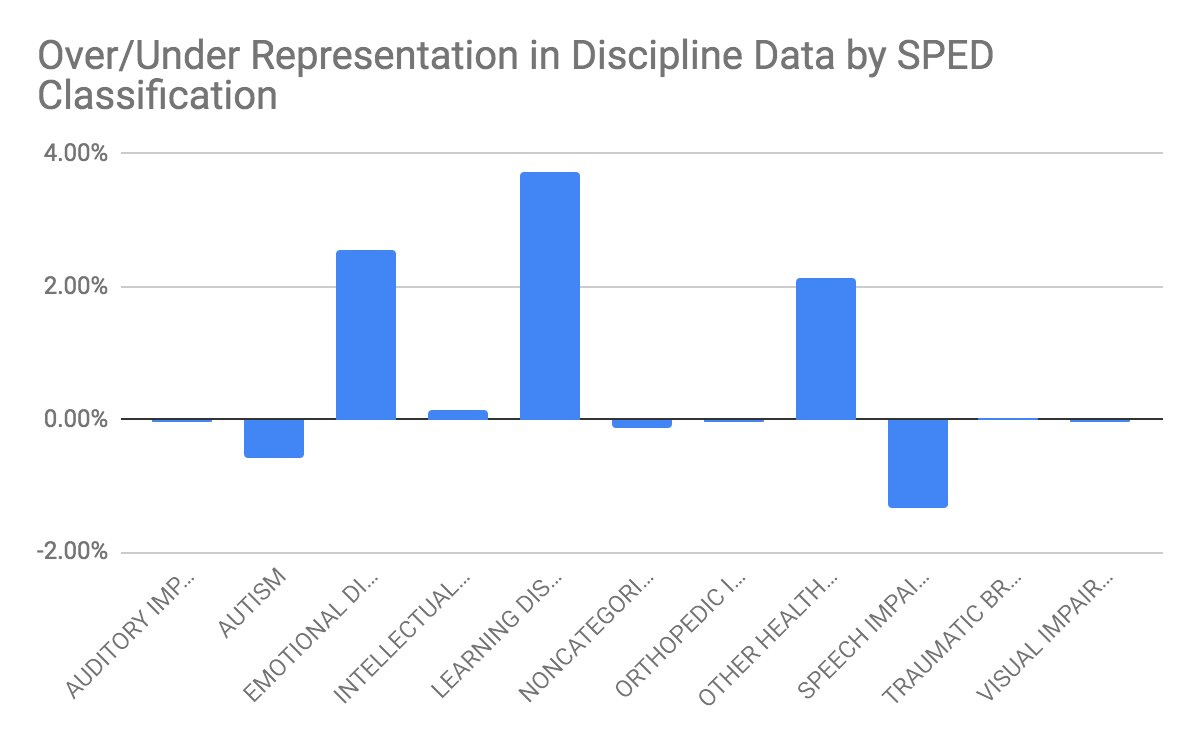
Information gathered through open records request shows that while students receiving SPED services are generally more likely to be disciplined, not all diagnoses are the same. Some diagnoses, like autism and auditory impairment, are actually slightly underrepresented in the data. Because very young children cannot be suspended or expelled in Texas, speech impairment and “non-categorical early childhood disabilities” are also underrepresented.
So most of the kids being suspended, expelled, and sent to alternative schools are not hearing impaired, autistic (with a formal diagnosis), physically impaired, or in speech therapy.
They are a different group of children, ones that, because of their disabilities, do things that come to mind when you think of misbehavior.
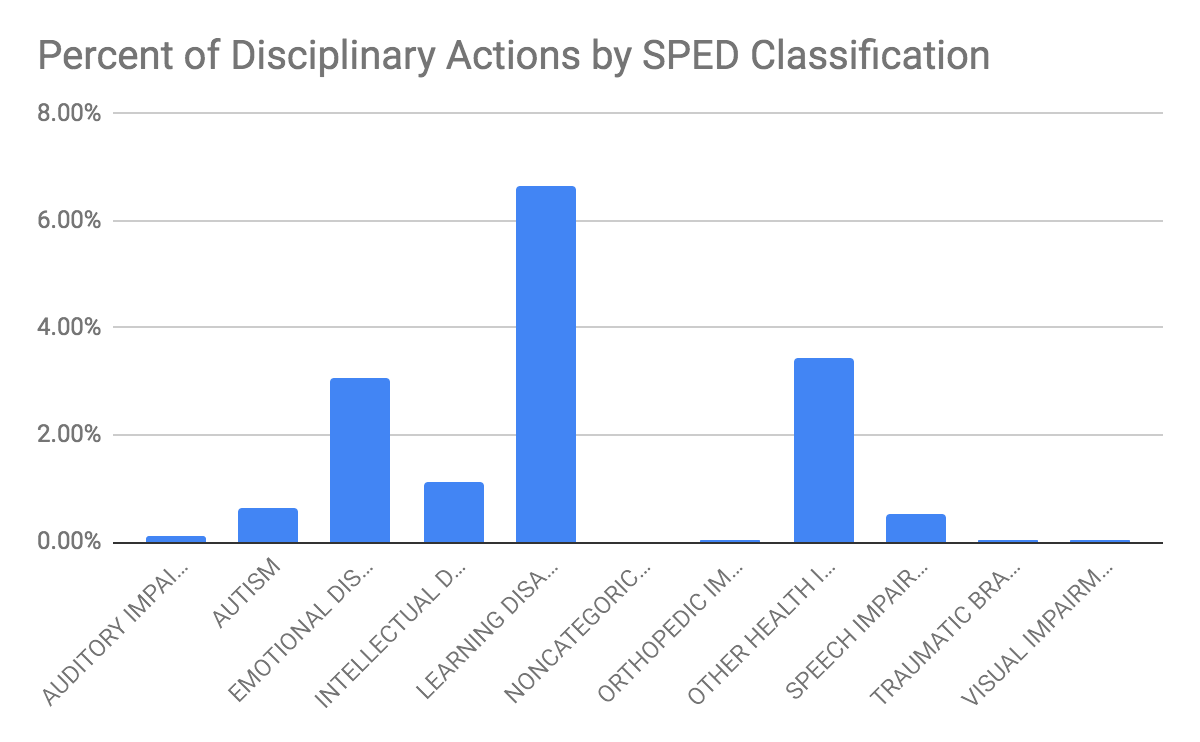
Two diagnoses in particular were the most overrepresented in the 2017–2018 disparity: Learning disabilities (which includes ADHD) were overrepresented by 3.73 percentage points, and emotional disturbance by 2.54 percentage points. The data also shows that in each of these categories the same students are receiving multiple disciplinary actions, though it’s impossible to tell the highest number given to one student.
This data doesn’t surprise Jennifer Fitzhugh, an advocate for families receiving SPED services. Students whose disabilities affect their behavior (such as emotional disturbance), or who are the most frustrated by classroom expectations (those with a learning disability), are likely to disrupt class, push back against teacher requests, and otherwise engage in “defiance,” as defined by most codes of conduct. “It’s the kids that don’t fit in the box that are going to demonstrate those behaviors,” she said.
This series, Punished, Not Served: Unfair Discipline for Students with Disabilities, has three more installments:
- Part II: Kids Being Disciplined for Their Disabilities—How kids who don’t “fit in the box” could land in alternative school.
- Part III: No One Seems to Want These Kids in Class—The story of a mom who struggled to get a school to meet her son’s needs instead of just sending him home.
- Part IV: The Battleground of Toileting—When a special education plan requires the adults to assist a child with bathroom duties, there can be resistance, shame, and missed learning time.