
After this summer’s racial reckoning, it should surprise exactly no one that special education services are among the things affected by systemic racism and implicit bias.
An open records request of Texas public schools 2019–2020 special education services disaggregated by race, socioeconomic status, gender, and SPED classification (autism, auditory impairment, learning disability, etc) revealed some of the contours of how special education reflects and reinforces other disparities in our state and country. Who you are may influence what kinds of educational services you are offered.
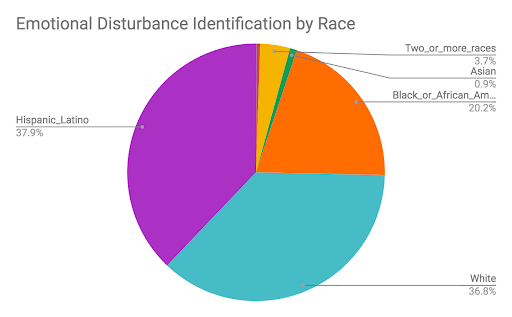
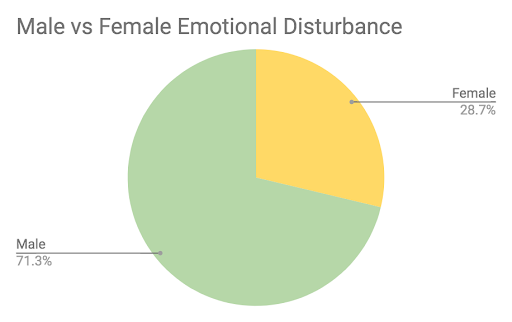
- Black students, who make up 12.6 percent of the Texas public school population, make up 20 percent of the “emotional disturbance” classifications.
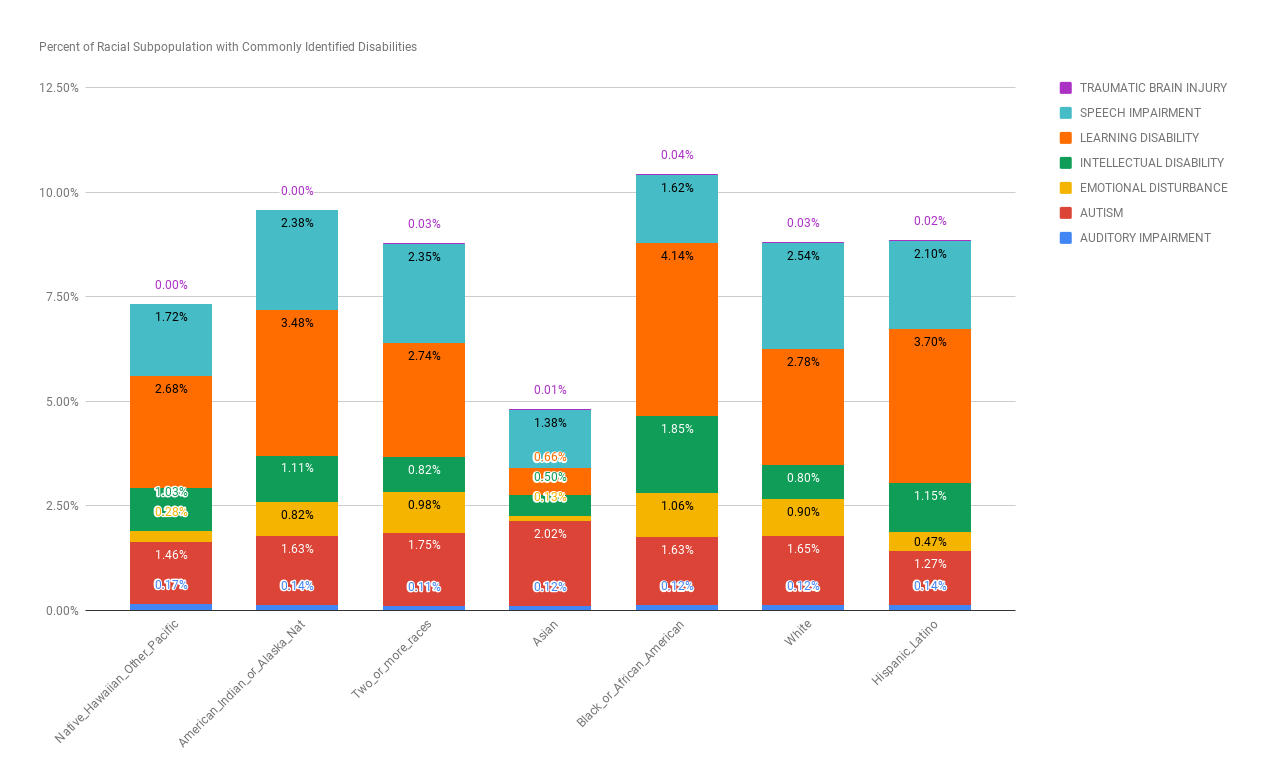
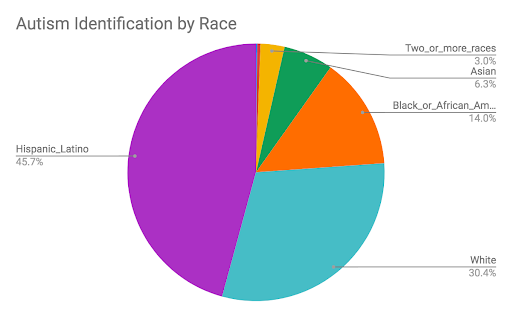
- Asian students, who make up 4.6 percent of the Texas public school population, have one of, if not the lowest rate of identification in every classification except autism, where they make up 6.3 percent of classifications, and have the highest rate of identification out of all racial groups.
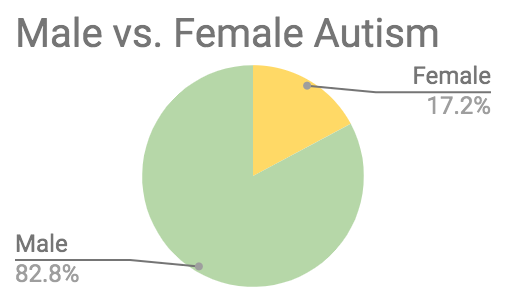
- Of all students receiving special education services, 66 percent are identified as male. Males also make up 83 and 71 percent of autism and emotional disturbance classifications, respectively.
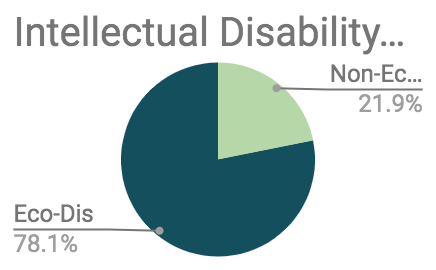
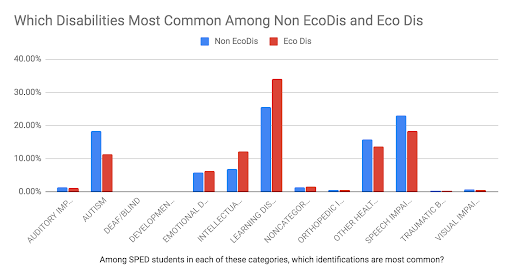
- In Texas, 60 percent of students are considered economically disadvantaged. Among those classified as having intellectual disabilities, 78 percent are economically disadvantaged.
It’s easy to overlook these disparities in a state known for generally neglecting special education services. For years, Texas artificially suppressed its special education numbers until an investigation by the Houston Chronicle led to federal action.
While journalists and watchdog groups monitor the state’s glacial crawl toward compliance with the laws governing special education, that total number—which needs to go from 8.5 to around 12 or 13 percent of the population—isn’t the only benchmark of services equitably delivered. In fact, as we move that big, aggregate number, the disparities within it will become more important than ever.
In 2019–2020, 10.7 percent of Texas public school students received special education services. Those students brought in extra money to their districts to provide those services. However, not every disability classification carries the same cost—some require only accommodations, while others require one-on-one aides—and not every disability carries the same stigma. Some classifications are driven by doctors and medical specialists—such as hearing loss and visual impairment—while others are determined by teachers, parents, and special education specialists who gather evidence about the inner workings of a student’s invisible neurology.
To understand the disparities within special education, it’s important to consider the classification process and the resources tied to each classification, says Dr. Jillian Whatley, Executive Director of Student Support Services in Clark County Schools in Georgia. Whatley researches disparities in special education. Before she saw the Texas numbers, she was able to guess which groups were over and underrepresented in which categories.
Those classifications with medical identification—like orthopedic, auditory, and visual—have relatively even distribution between racial groups. Disparities show up when human interpretation is involved.
Whatley’s research showed that implicit bias affected how teachers perceived the behavior and academic performance that would lead students to a special education evaluation, and that the language used in referrals greatly influenced the outcome of the identification process. A second “confirmatory bias” then locked in those perceptions when a student was evaluated by whatever specialist will determine their official classification.
“If you say certain words that is where you’re going to move the psychologist in a direction,” Whately said. Her research showed that some teachers went so far as to suggest a student “may be autistic” and described “inability to focus” rather than the specific behaviors open to interpretation. In her practice another word, “aggression” comes up a lot, in her experience.
“Aggression”
Studies show that white teachers are more likely to read aggression in their black students, which will inform the way they describe what they are seeing in the classroom. Aggressive behaviors, especially those that seem to be isolated from academic or intellectual issues, commonly lead to the emotional disturbance classifications, Whately said. By contrast, when the social behavior is perceived as atypical, but not necessarily aggressive, the child is more likely to be classified with autism, sensory processing disorder, or another learning disability.
Girls are also perceived, in general, as less aggressive, though black girls are still more likely to be perceived as aggressive. That disparity shows up in the data as well.
Parents advocating on behalf of their students with special needs are subject to the same biases, Whatley said, especially Black parents, who are often described as “aggressive” when advocating for their children.
When working with teachers, SPED teams, and principals, Whatley asks them to describe specific behaviors, not the tone or perception they have of the parent. Once she meets with the parent, she finds more pain and frustration than threat. “Once you work through the hurt and the pain, the frustration kind of melts away,” she said.
Normal? Or Cultural? Or Stereotype?
In addition to being perceived as less aggressive, studies found that some standard autism screening tools lead to over-identification of Chinese students, because cultural social expectations, like eye contact, are considered normative for all students. Researchers Jie Zhang, et al, found cultural mismatches in several common screening techniques, and recommended that social and behavioral components of screening need to be culturally adjusted to avoid misidentification.
Teachers and special education staff have also been shown to use white middle class norms to evaluate other groups, leading to a misidentification of specific disabilities.
Stereotypes of both autism and male/female behaviors work against proper identification of girls with autism as well, according to The Child Mind Institute. The signs that clinicians use to look for autism, author Beth Arky explains, are more common in boys. Girls are, in some ways, socialized toward interests that look more imaginative and emotional, like unicorns and fairies, but the way they engage them might be similar to how a boy with autism takes interest in train schedules or other data. After a lifetime of being expected to smile more often and be more socially pleasing, behaviors that can be learned by girls with autism, when girls continue to struggle socially, they are more likely to be identified with depression or anxiety, Arky reported.
Fighting for Resources
Teachers are not the only ones influencing identification; parents affect the process as well. However, Whatley explained, whereas a teacher might be incentivized to use SPED classifications to get relief from state accountability or to explain low achievement, parents may be motivated by resources and accommodations.
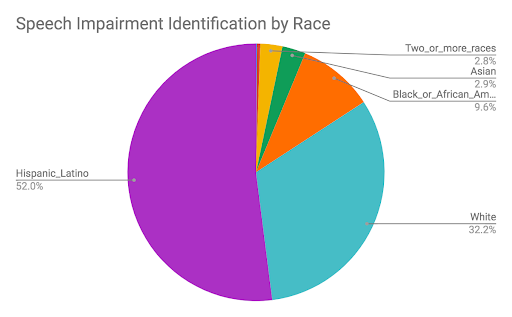
White students are over-represented in speech impairments, a classification tied to explicit, therapeutic services. Speech therapists are often spread thin across a district, because other disabilities often require speech therapy as well. It’s important to note here that the state data only includes students’ primary classification. Many of the students with intellectual disabilities will require multiple services across classifications. The fact that white students are overrepresented in speech impairment on its own doesn’t mean that more white students have that classification overall. It means that more white children are receiving special education services based only on a speech impairment. They are classified with a disability in order to access a particular therapy.
“Resources is a huge piece of it,” Whatley said, “It’s often time a tug-of-war to get kids’ speech services.” Without a SPED classification, few will get the therapy. The more time a parent has to spend hounding the district, and the more connected and powerful they are within the district, the more likely they will be able to pull the necessary levers to pull those resources their way. Whatley confirmed what some local school counselors have said as well: because the SAT and ACT allow more time for students with certain learning disabilities, parents of sophomores and juniors in high school will find ways to have their student classified with dyslexia or ADHD to get that extra time.
White and middle class parents more often use SPED classifications to access resources, Whately explained, but she has also seen Black and low income parents fight for special education classifications when they knew their child was being over-disciplined. Better that the “aggression” be labeled a disability than simply be suspended over and over, at least in theory. In reality, of course, the suspensions and expulsions don’t necessarily stop with a SPED identification. Students with special education classifications are far more likely to experience exclusionary discipline than their peers.
Teachers who want “disruptive” students out of a class will often use specific language to make that happen, Whatley said. Similar to the classification process, she explained, teachers and parents know how to cast a students’ behavior as dangerous. She also confirmed something I have observed in my reporting: the tell-tale use of phrases like “throwing chairs” to build a case to have special education students removed from general education classrooms. Choosing dramatic or aggressive descriptions of behavior without the context of what led to the incident. Parents do this, too, by the way, when they want their child’s classmate removed.
Towards a Kinder World
Whatley’s research found that when given implicit bias training, many teachers and specialists were able to see how their special education referrals reflected their biases. She recommends that teachers, school psychologists, and all of those involved in the referral process go through training. Implicit bias training won’t eliminate their biases, she said, but it could help them account for it when they are trying to figure out what’s behind certain student behaviors or academic issues.
“While policies and procedures are implemented to impose accountability measures to ensure equitable practices in P–12, Bias Literacy Workshops and the IAT-Race provides educators with tools to become change agents and practice mitigating bias in practice,” Whatley wrote in her doctoral dissertation research.
Those policies and procedures, however, at least in Texas, must be further scrutinized, she acknowledged. How school systems allocate funding—and determine eligibility for services—goes a long way in creating these disparities. Data shows where racial bias and parental privilege are leaking into services that are supposed to deliver more equity.
“We have a system that allows that,” Whately said.

About the Author
Bekah McNeel is a San Antonio-based education writer who focuses on equity, innovation, and social-emotional learning for publications such as The 74. Over the years, we have republished local education coverage from her Hall Monitor site, and last November she wrote for us a four-part series, “Punished, Not Served,” about unfair discipline for students with disabilities.
Read More
- “Can Reading Cure ADHD? It’s More Complicated Than That,” Bekah McNeel, San Antonio Charter Moms, August 26, 2020
- “Evidence-Based Literacy Instruction,” Bekah McNeel, San Antonio Charter Moms, August 12, 2020
- “Identifying Hearing Loss in Children, and Finding Help From Friends,” Bekah McNeel, San Antonio Charter Moms, July 29, 2020
- “Vision Therapy Might Be the Solution for Your Child’s Learning Disorder,” Bekah McNeel, San Antonio Charter Moms, July 8, 2020
- “One Mom’s Experience with a Dyslexia Simulator,” Bekah McNeel, San Antonio Charter Moms, June 24, 2020
- “Celebrate Dyslexia: Education, Identification, and Celebration of Dyslexic Students,” Bekah McNeel, San Antonio Charter Moms, June 10, 2020