

When a family is choosing a new home, moving to a new city, or even just looking to change schools after a negative experience, they have ample tools at hand. Great Schools, Niche, and state accountability ratings can tell a family looking for a “good school” where to look.
For the parents of children who learn and process outside the bell curve we call “neurotypical,” that search can be more specific, and often more difficult. Just because a school does well by its high achievers and its middle class attendance zone does not mean that every child in the building is getting what they need.
State data grows more granular by the decade in an attempt to capture this, but parents will most likely find themselves turning to Facebook groups and other avenues by which word-of-mouth travels.
Fundamental to the school choice movement is the belief that children learn differently, and need different things. Students who have struggled in traditional public school have often found great success in charters with different curriculum or structures. Some have found relief from dysfunctional or ineffective environments simply by switching schools in the same school district.
In my reporting I have talked to parents and neurodiverse students who have struggled in Northside, SAISD, Great Hearts, IDEA, Basis, North East, South San, and Alamo Heights. I’ve talked to parents and neurodiverse students who thrived in Northside, SAISD, Great Hearts, IDEA, Basis, North East, South San, and Alamo Heights.
One policy, teacher, specialist, principal, or program could have made the difference one way or the other. But what worked for one child did not work for every child. For the parents of children who learn and perceive the world differently, there are no guarantees, so what follows should be taken as one of many resources parents might use in their search.
The Texas Education Agency does monitor academic and disciplinary data for students who receive special education, as well as other groups, like English Language Learners and those who qualify for free and reduced lunch. This data can tell us something about the academic and social conditions facing students who require special education services. It can give parents a place to start the conversation.
Data is never the whole story. It’s the X on the map that says, “dig here.” In this case, the TEA’s Results Driven Accountability Reports provide some valuable plot points on the treasure map as parents hunt for the right education for their child.
Whether or not we agree that tests are the best way to quantify real learning in an individual student, they are a great way to identify gaps in learning for populations. Accountability tests are subject to accommodations. Gaps tell us about the circumstances—economic, social, and educational—students face. Where gaps show up, someone isn’t getting what they need.
An alternate test exists for students with severe cognitive disabilities and some students are exempt entirely if their disabilities are severe enough. However, as parents know, many students who have been identified with dyslexia, autism, emotional disturbance, ADHD, and other learning disabilities can and do keep up with their classmates academically. If the right support is there, then these students as a population should not be dramatically behind their peers in general education.
In the San Antonio Metro Area, STAAR scores for students receiving special education services follow as the general population: income and STAAR scores are highly correlated. The fewer kids receive free and reduced lunch in the district, the higher their test scores. IDEA Public Schools is an outlier in this regard, as it is on most standardized tests.
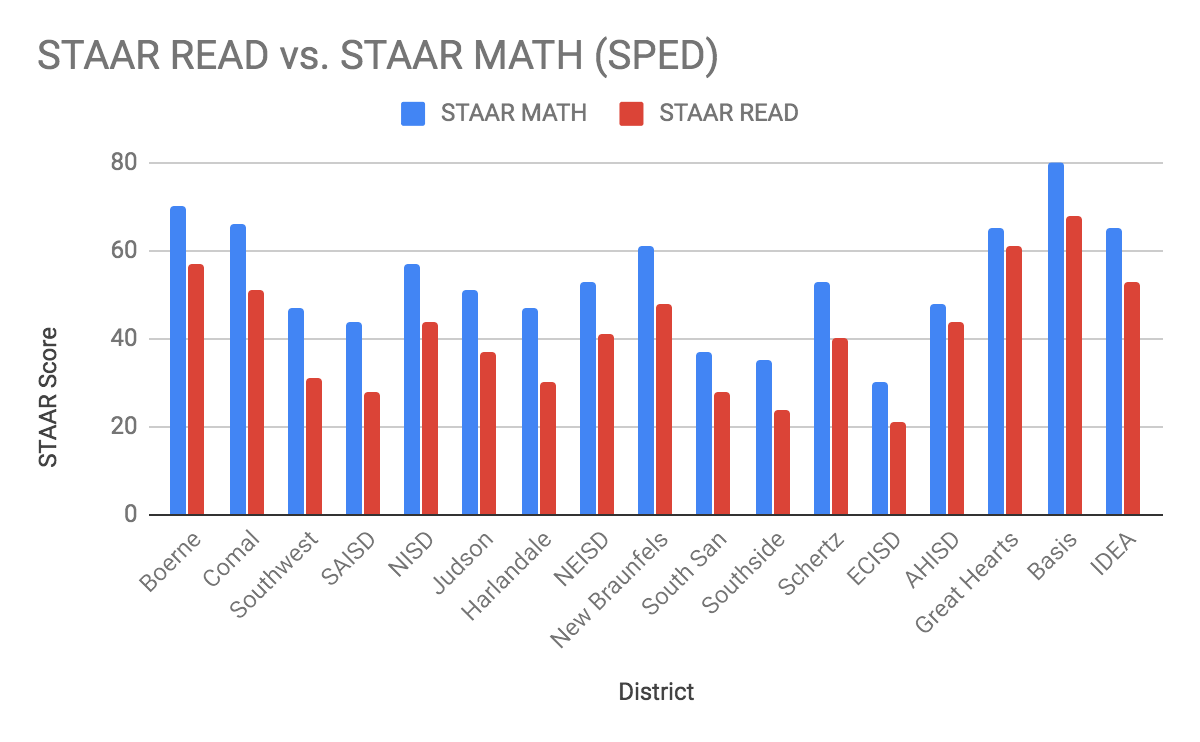
What are the STAAR scores (in math and reading) for special education students at districts in San Antonio?
So I looked at another set of factors: What’s the gap between the school’s overall test score and their special education test scores? Both are benefitting from socioeconomic status, but that does not mean that the special education services of the district are effective.
Of the 14 districts and three charter networks I analyzed, the median 2019 STAAR scores for students who receive special education services were 27 points lower in math and 35 points lower in reading. Reading scores hovered closer to the median, while math scores diverged greatly.
BASIS charter schools had the smallest gap in math scores—only 16 points—followed by Boerne ISD and IDEA Public Schools with 19 points. In reading, BASIS again had the smallest gap, 28 points, followed by IDEA and Great Hearts with 29 and 30. San Antonio ISD had the smallest reading gap of the traditional school districts, 31.
Alamo Heights ISD had the largest gaps between special education test scores and overall test scores, followed closely by Schertz-Cibolo-Universal City ISD and East Central ISD. East Central also had the lowest reading and math scores for SPED students overall.
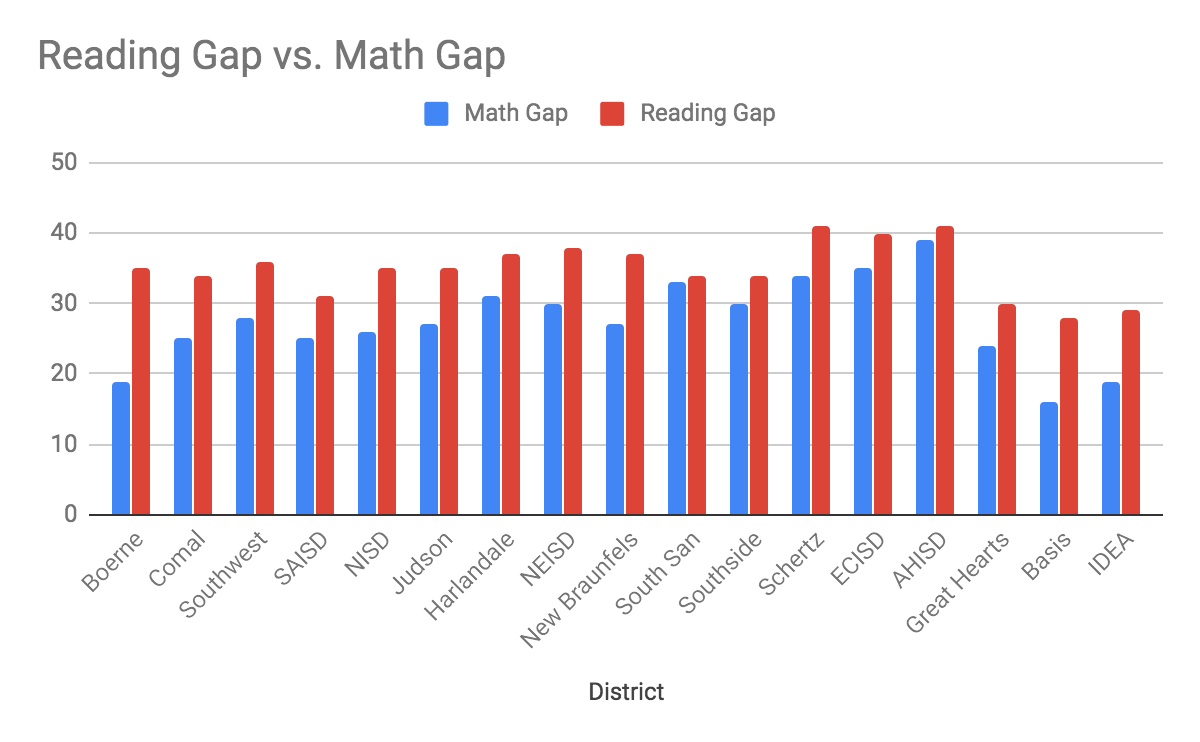
What are the gaps between a district’s overall STAAR test scores (in math and reading) and their special education test scores?
The other factor that shed some light on how well a district delivers special education services: discipline. Students who receive special education services are disproportionately disciplined in Texas on the whole, but the Results Driven Accountability reports include discipline rates for the various groups (special education, English learners, homeless students, etc.) in each district.
It’s worth knowing if suspension, expulsion, and alternative school are common tools employed by the school district, especially for students who may act out or resist conformity for reasons related to their disability. In addition to the disabilities that primarily affect social behavior, frustration, sensory overload, stress, anxiety, and embarrassment often end in discipline for students with learning disabilities.
Alamo Heights had the lowest exclusionary discipline rate for special education students: 18 percent. The only one lower was IDEA, at six percent, but with an important caveat that Black students with emotional disturbance are disproportionately disciplined, according to the report.
Great Hearts, 19 percent, and Boerne, 21 percent, are the next lowest discipline rates. The highest are Judson ISD at 72 percent, North East ISD at 57 percent, and East Central at 54 percent.
So there’s a huge data download, some X’s for the treasure map. But based on everything else we know, do consider these footnotes:
- The state’s SPED accountability data is not disaggregated by classification (autism, auditory impairment, etc.), and as we know, race and income play a large role in how a disability is classified. Middle class parents and white parents tend to push for classifications that allow them to access more resources, which will help that student succeed academically and socially. Their test scores and discipline rates reflect this.
- Again, because we do not have the data disaggregated by classification, we cannot say that charters universally serve students with special needs better than districts. Within a small choice system, it’s entirely possible for one classification, like ADHD, to be over-represented and another, like emotional disturbance, to be under-represented.
- Discipline rates are easy to tinker with. Schools can just send a kid home after an outburst without officially suspending him or her. They do it all the time.
While I don’t want to end this series on a negative note, I do want to highlight the work left to do. It’s easy, in these days of competitive schooling, where students compete against each other and schools compete for students, to focus on the “best” school for special education and the “worst” schools. That was not what stuck out to me. What stuck out to me was the work to be done across the board.
Though there was quite a range of disciplinary rates, they are all, frankly, disturbingly high. The gaps in achievement are large. If we’re going to work towards a kinder world, it’s not enough to have the least bad stats. We all need to do better. 
About the Author
Bekah McNeel is a San Antonio-based education writer who focuses on equity, innovation, and social-emotional learning for publications such as The 74. Over the years, we have republished local education coverage from her Hall Monitor site, and last November she wrote for us a four-part series, “Punished, Not Served,” about unfair discipline for students with disabilities.
Read More
- “Who Gets SPED Services in Texas? A Special Education Data Analysis,” Bekah McNeel, San Antonio Charter Moms, September 16, 2020
- “Can Reading Cure ADHD? It’s More Complicated Than That,” Bekah McNeel, San Antonio Charter Moms, August 26, 2020
- “Evidence-Based Literacy Instruction,” Bekah McNeel, San Antonio Charter Moms, August 12, 2020
- “Identifying Hearing Loss in Children, and Finding Help From Friends,” Bekah McNeel, San Antonio Charter Moms, July 29, 2020
- “Vision Therapy Might Be the Solution for Your Child’s Learning Disorder,” Bekah McNeel, San Antonio Charter Moms, July 8, 2020